When choosing this option, it will be loaded initially always automatically and in a matter of seconds, a first window with information in statistics and graphics related to all the third parties uploaded so far by your company and the state in which they are.


As you can see in the graphs, the tool will give us this general information of third parties loaded in different ways, which are all in turn linked to each other:
Statistics of third party status
Evolutionary third party in time
Third-party map
Status of third parties by country and third parties by country
Status of third parties by sector and third parties by sector
1. Statistics of third party statements

Here we will find a statistic, which will inform us the state in which are all the third loaded so far by the company, identified with a color, according to the state in which they are. The color, with which each possible state of a third party is identified, will allow us to perform an analysis of the graphs in a simpler way, for example: in the graphs, the status of the third "Approved" in green.
This information will then be displayed flipped on the following charts with different reading options.
2. Evolution of third parties over time

In this first chart, we will find information about the evolution in time of the status of third parties loaded by our company.
How do we read this chart?
Horizontal axis

The horizontal axis of the graph indicates the months of the last year. The graph shows that they are indicated, the lapse of the months from January 2022 to January 2023.

In the vertical axis, a percentage of 0% to 100% is observed, which will refer to the percentage of the states in which third parties are loaded during the past months.
Inside the chart

Inside the graph, we will find curves of different colors. Each color corresponds to a state in which the third parties we have loaded can be found. For example, the green color indicates the status of third parties "Approved". We must associate these curves, to the two axes mentioned above and the color of them.
How to scroll through the graph?
The chart will initially always be presented to us, with the information of the third parties' status during the last twelve months.

But it will allow us to personalize it; and move in the interval of months in which we have interest to perform a more detailed analysis.

In this graph, we observe as we indicated to the same, to show us specifically what happened between the months of October and December.

To be able to individualize the status of third parties, in the span of months we want to analyze, we must indicate clicking and moving the cursor inside the graph, between the months we want, which are shaded. As seen in the chart, once we release the cursor, the chart will automatically indicate the information we require.
 Once we have analyzed the state of the third parties, in the course of the months we have indicated, if we want to return the graph to its initial state, we must click the blue circle with a sign - inside, which is located at the upper right of the graph.
Practical example

In this graph, we indicate to the same, to indicate the evolution of third parties in time, elapsed between the months of October to December. If we analyze the green curve, which corresponds to the state of the third "approved", we can deduce that at the end of October and beginning of November there was an increase in the approved third parties.
3. Map of third parties
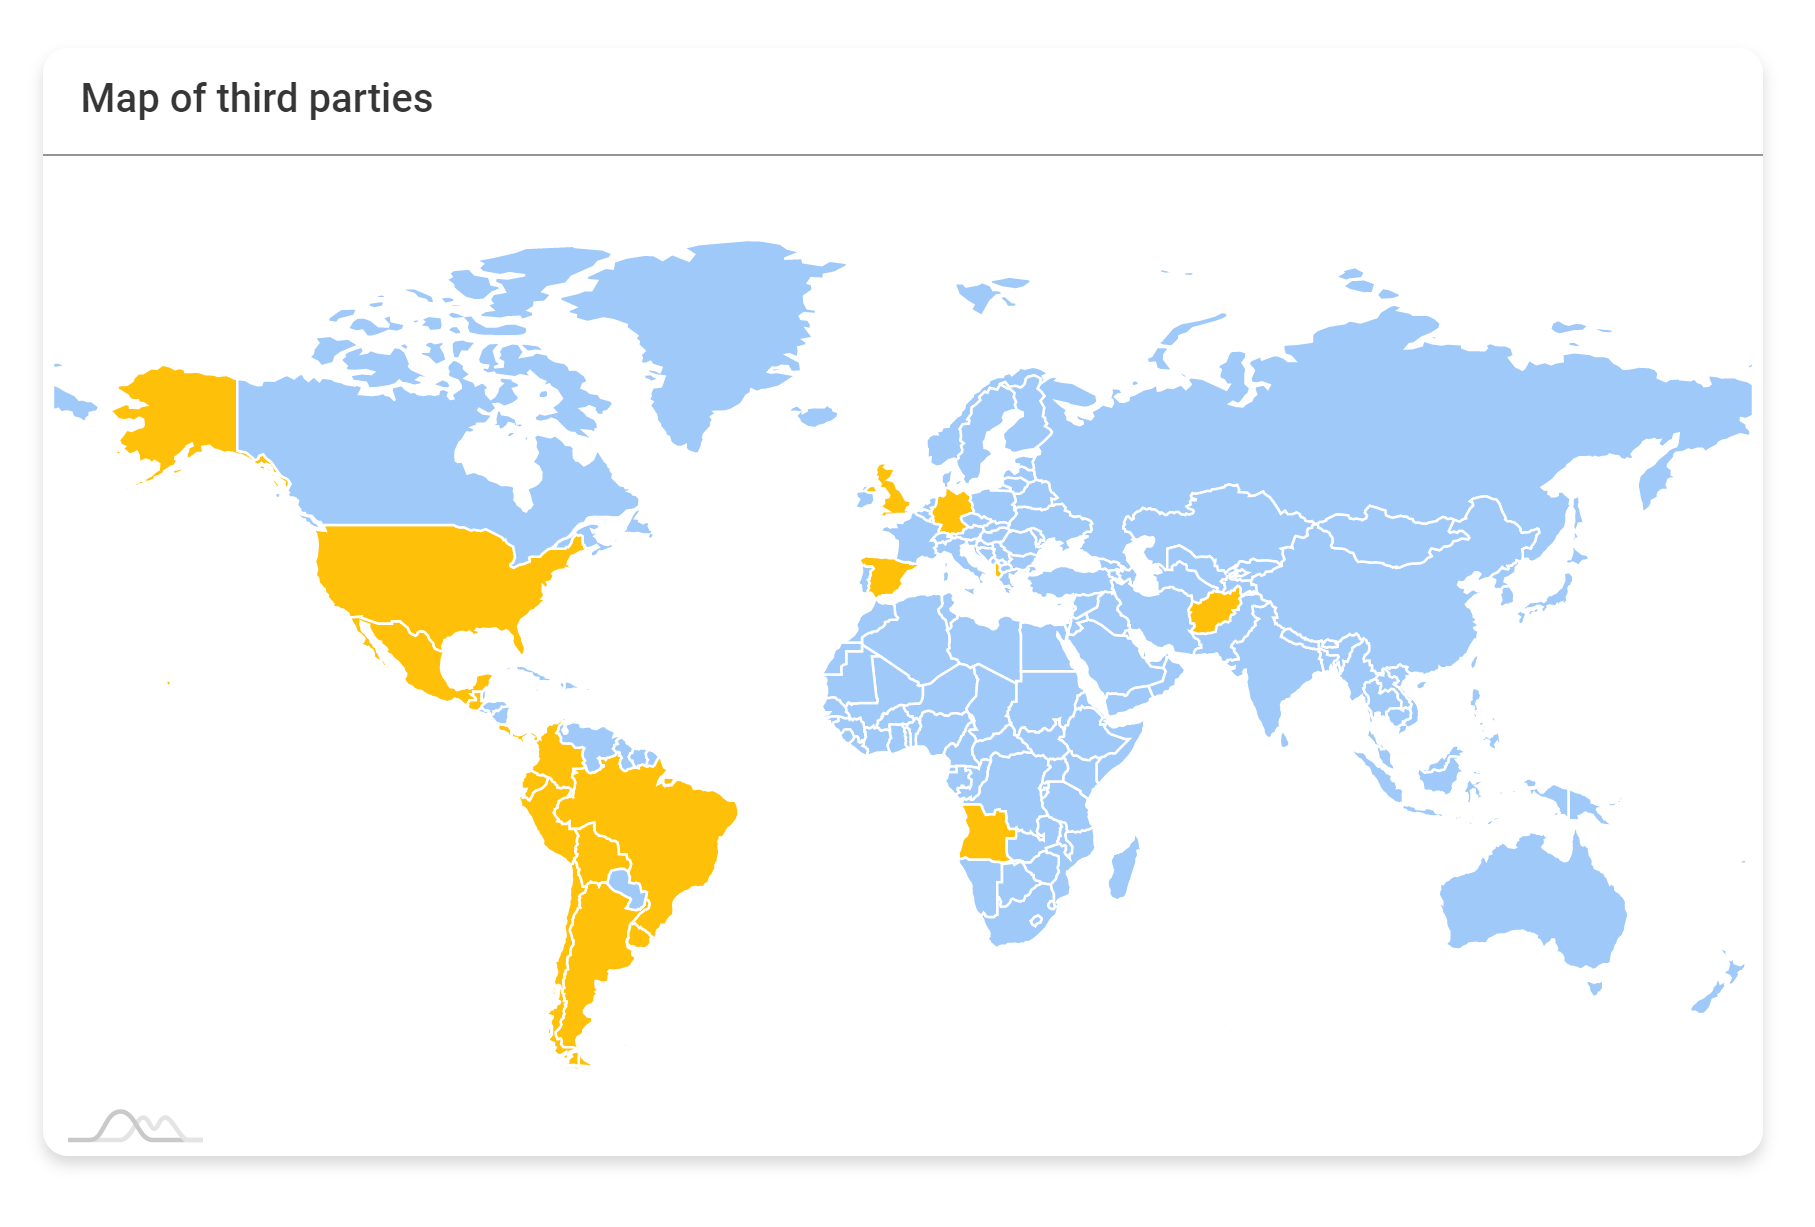
This map will tell us in which countries are the third parties of our company that we have loaded on the platform. Countries that are yellow will be the countries where our company has third parties.
4. State of third parties by country and third parties by country
- Status of third parties by country
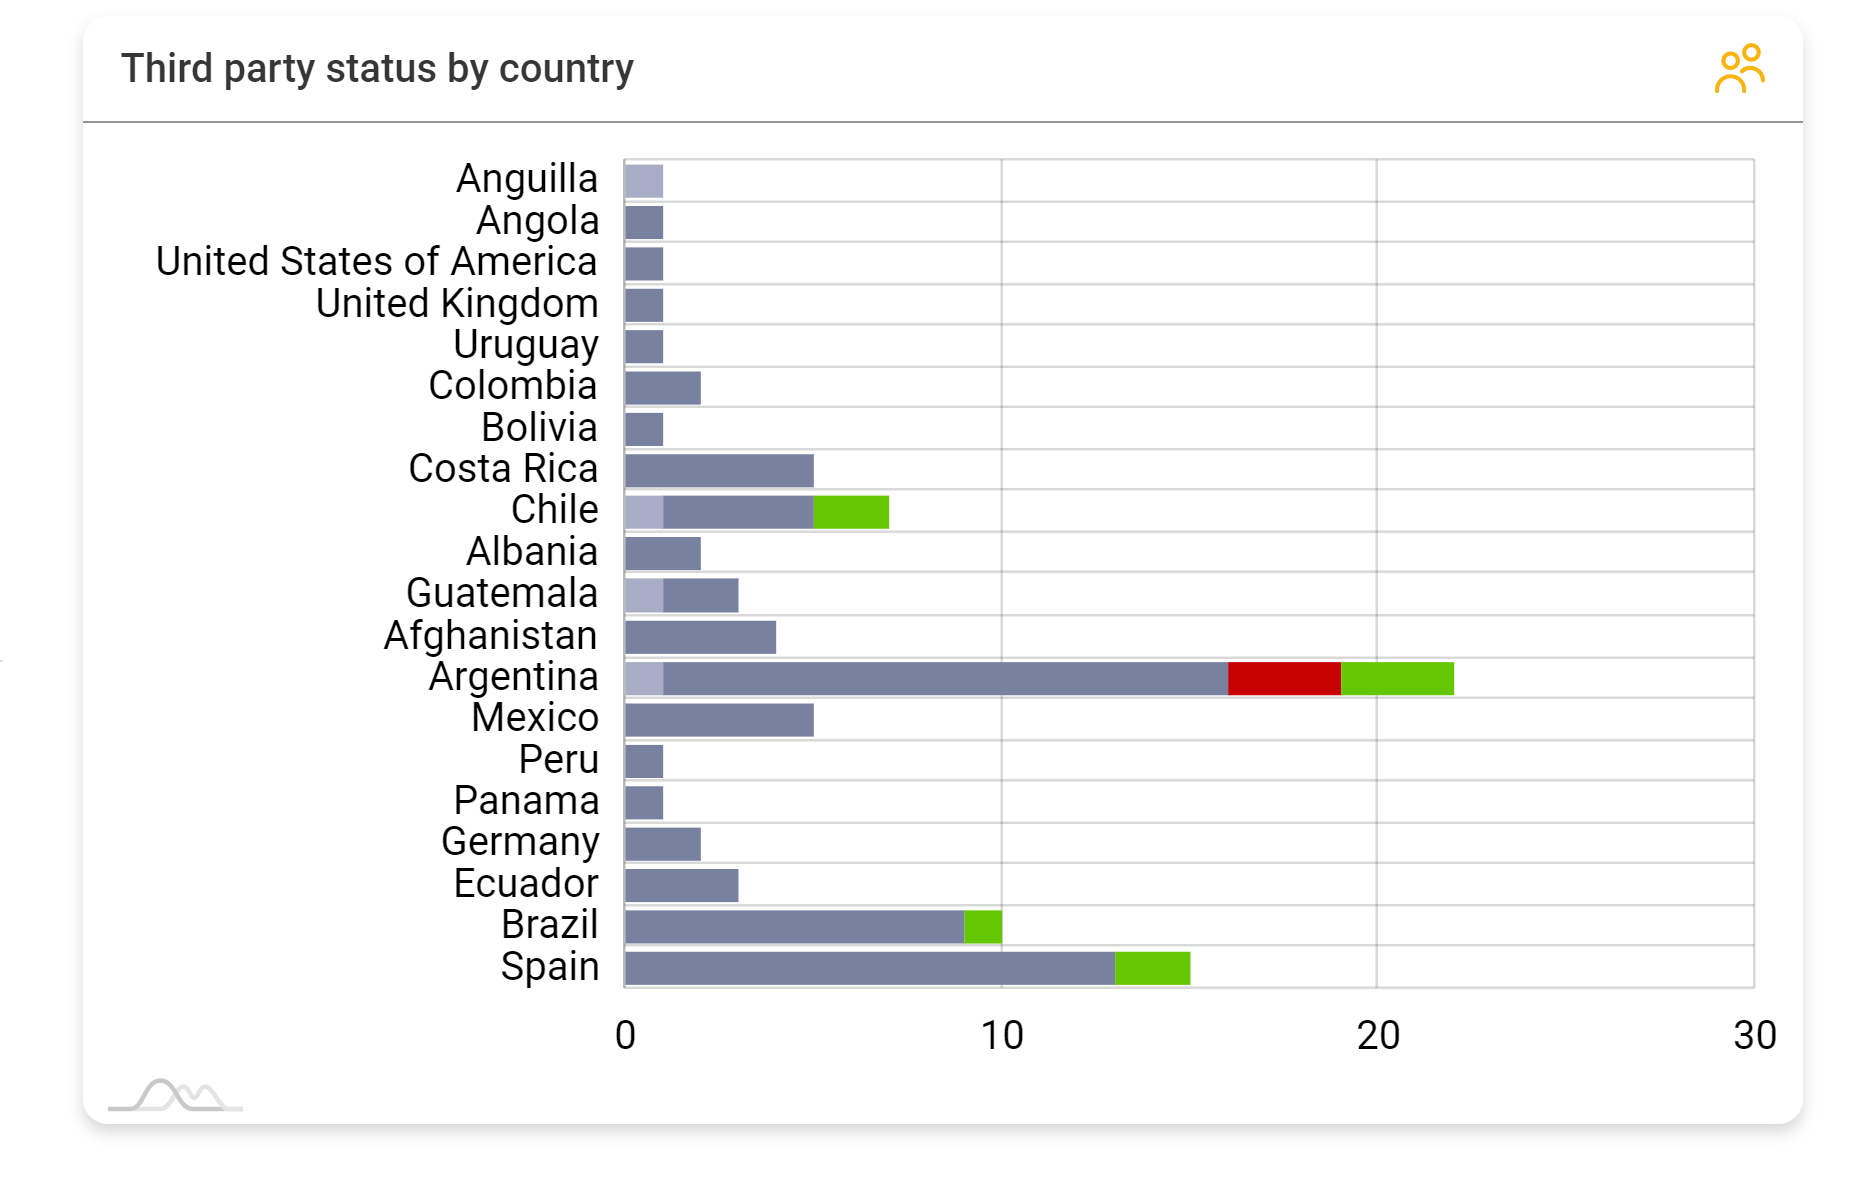
This graph will show us two types of information, first the number of third parties we have in each country and second the state in which they are.
The vertical axis will indicate the countries where we have registered third parties; and the horizontal axis the number of third.
The horizontal bars will indicate, according to the color, the state in which a certain number of third parties are in each country.
For example, in the graph we can deduce that in the country of Chile, the company has two registered third parties, of which one is in state "Pending Evaluation" (gray) and another is "Approved" (green).

If we rest the cursor on a certain color of the horizontal bar, we will be told which state corresponds to that color and the number of third to which it refers, as seen in the graph.
- Third parties by country

This chart will only tell us the number of third parties registered that the company has in each country.
The vertical axis will indicate the countries where we have registered third parties and the horizontal axis the number of third.
The horizontal bars will tell us the number of third parties and the country where they are located.
For example, in the graph we can deduce that in the country of México the company has five registered third parties.

If we rest the cursor on one of the horizontal bars, we will be told the number of third that corresponds to that country, as seen in the graph.
5. Status of third parties by sector and third parties by sector
Status of third parties by sector

This graph will show us two types of information, first the number of third parties we have in each sector, and second, the state in which they are.
The vertical axis will indicate the sectors where we have third registered and the horizontal axis the number of third.
The horizontal bars will indicate, according to the color, the state in which a certain number of third parties are in each sector.
For example, in the graph, we can deduce that in the Technology sector, the company has thirty five registered third parties, of which one is in state "Pending Evaluation" (gray), twenty six in state "Evaluating" (dark gray) only one are in state " Denied" and six "Approved" (green color).

If we rest the cursor on a certain color of the horizontal bar, we will be told which state corresponds to that color and the number of third to which it refers, as seen in the graph.
Third parties by sector

This chart will only tell us the number of third parties registered that the company has in each sector.
The vertical axis will indicate the sectors where we have third registered; and the horizontal axis the number of third.
The horizontal bars will tell us the number of third parties and the sector where they are located.
For example, in the graph, we can deduce that in the Technology sector the company has thirty five registered third parties.

If we rest the cursor on one of the horizontal bars, we will be told the number of third that corresponds to that sector, as seen in the graph.
Select type
Finally, Riskboard Third Party, gives us the possibility to perform the analysis of the third parties loaded so far by our company and the state in which they are, but reducing their study to specific Third Party Categories. That is, focusing the analysis on third parties in a certain category, for example analyze everything already explained, but only with third parties in the category Suppliers (not all of the third parties, without discriminating the category to which they belong, which shows us the tool automatically choosing the option Riskboard Third Party).

The first step is to choose the "Choose type" option shown in the chart.

There, a list will be displayed with the name of each category of third that we have configured previously in the tool, having to choose the Third Category that we want to analyze.
In this case, as an example, we chose the categories of third Customers and Suppliers.


We can see in the graphs, as the tool released all the information on the points already explained ( Statistics of third party states - Evolution of third parties in time - Map of third parties - State of third parties by country - Third parties by country - State of third parties by sector - Third parties by sector), but reduced to third parties that integrate the categories of third parties selected in this case for analysis.
Download your report!
